Avaliação do desempenho analítico de parâmetros bioquímicos do laboratório de análises clínicas de um hospital público
Barbara Rahn1; Ales Jerin2; Milan Skitek2; Nada Snoj2; Flávia Martinello1
J Bras Patol Med Lab. 2021; 57: 1-10.
DOI: 10.5935/1676-2444.20210054
ABSTRACT
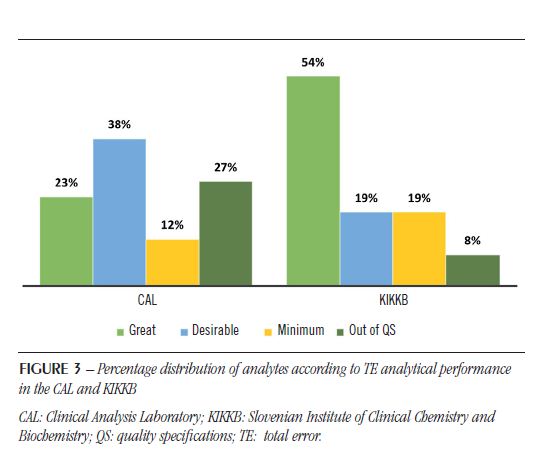
Introduction: Every process is subject to variation in the results of repeated analyses, that is why quality control was conceived to measure and evaluate this variation. In addition to the daily analysis of control results, a long-term assessment should evaluate the analytical performance of each method for inaccuracy and imprecision according to quality specifications (QS). Objective: This study aimed to evaluate the analytical performance of biochemical parameters of the Clinical Analysis Laboratory (CAL) of a Brazilian university hospital, according to the QS based on biological variation and comparing to an international laboratory. Material and method: Twenty-six biochemical parameters were analyzed. The QS for coefficient of variation (CV), bias and total error (TE) were calculated according to the intraindividual (CVbi) and interindividual (CVbg) biological variation of the analytes described in the literature. The sigma metric (σ) was also calculated based on desirable TE and Clinical Laboratory Improvement Amendments (CLIA). Results: Calcium and sodium analytes were out of the QS for all criteria used (CV, bias and TE) in both laboratories. CAL showed 19% of analytes (albumin, calcium, magnesium, total protein, and sodium) outside the QS in all criteria, and the international laboratory 8%. Using the sigma metric, the analytical performance of CAL was also inferior regarding to the comparative laboratory: 54% of analytes with σ < 3 versus 38%. Conclusion: The sigma metric was more rigorous in the evaluation of the analytical performance of biochemical parameters compared to the QS based on biological variation. The non-achievement of quality goals was not laboratory-specific.
Key words: total quality management; analytical quality control; quality control; benchmarking.
RESUMO
Introdução: Todo processo é passível de variação nos resultados de análises repetidas, por isso, o controle da qualidade foi pensado como forma de mensurar essa variação. Além da análise diária dos resultados de controle, deve-se avaliar, em longo prazo, o desempenho analítico de cada método quanto à imprecisão e à inexatidão de acordo com as especificações da qualidade (EDQ). Objetivos: Os objetivos deste estudo foram avaliar o desempenho analítico de parâmetros bioquímicos do Laboratório de Análises Clínicas (LAC) de um hospital universitário brasileiro em relação às EDQ baseadas na variação biológica e compará-lo com o de um laboratório de grande porte internacional. Material e método: Foram analisados 26 parâmetros bioquímicos. As EDQ para coeficiente de variação (CV), bias e erro total (ET) foram calculadas de acordo com a variação biológica intraindividual (CVbi) e interindividual (CVbg) dos analitos descritas na literatura. A métrica sigma (σ) também foi calculada com base no ET desejável e no Clinical Laboratory Improvement Amendments (CLIA). Resultados: Os analitos cálcio e sódio ficaram fora das EDQ para todos os critérios utilizados (CV, bias e ET) em ambos os laboratórios. O LAC apresentou 19% dos analitos (albumina, cálcio, magnésio, proteínas totais e sódio) fora das EDQ em todos os critérios, e o laboratório de grande porte, 8%. Utilizando a métrica sigma, o desempenho analítico do LAC também foi inferior ao do laboratório comparado: 54% dos analitos com σ < 3 versus 38%. Conclusão: A métrica sigma mostrou-se mais rigorosa na avaliação do desempenho analítico de parâmetros bioquímicos quando em comparação com as EDQ baseadas na variação biológica. O não alcance das metas de qualidade não se mostrou laboratório-específico.
Unitermos: gestão da qualidade total; controle analítico de qualidade; controle de qualidade; benchmarking.
RESUMEN
Introducción: Todo proceso está sujeto a variación en los resultados de los análisis repetidos, por lo que se pensó el control de calidad como una forma de medir esta variación. Además del análisis diario de los resultados de control, debe evaluarse el rendimiento analítico a largo plazo de cada método em cuanto a imprecisiones e inexactitudes según las especificaciones de calidad (EDC). Objetivos: Los objetivos de este estudio fueron evaluar el desempeño analítico de los parámetros bioquímicos del Laboratorio de Análisis Clínicos (LAC) de un hospital universitario brasileño en relación con las EDC basadas en la variación biológica y compararlo con el de un gran laboratorio internacional. Material y método: Se analizaron 26 parámetros bioquímicos. Las EDC para el coeficiente de variación (CV), el sesgo y el error total (ET) se calcularon según la variación biológica intraindividual (CVbi) e interindividual (CVbg) de los analitos descritos en la literatura. La métrica sigma (σ) también se calculó en base al ET deseable y al Clinical Laboratory Improvement Amendments [(CLIA) – Enmiendas de mejora del laboratorio clínico]. Resultados: Los analitos de calcio y sodio estuvieron fuera de las EDC para todos los criterios utilizados (CV, sesgo y ET) en ambos laboratorios. El LAC tenía el 19% de los analitos (albúmina, calcio, magnesio, proteína total y sodio) fuera de las EDC en todos los criterios, y el gran laboratorio, el 8%. Utilizando la métrica sigma, el rendimiento analítico del LAC también fue inferior al del laboratorio de comparación: 54% de analitos con σ < 3 versus 38%. Conclusión: La métrica sigma demostró ser más rigurosa en la evaluación del desempeño analítico de los parámetros bioquímicos en comparación con las EDC basadas en la variación biológica. El incumplimiento de los objetivos de calidad no fue laboratorio-específico.
Palabras clave: gestión de la calidad total; control analítico de calidad; control de calidad; benchmarking.
INTRODUCTION
Every process is subject to variation in the results of repeated analyses, that is why quality control was designed as a way to measure and assess this variation, in addition to indicating opportunities for improvement, in order to keep the results within reliable limits(1).
Through the analytical coefficient of variation (CV), the Internal Quality Control (IQC) assesses the accuracy of an analytical method, that is, how close to each other are the results of the same sample analyzed at different times. The External Quality Control (EQC) evaluates the accuracy of the method through the bias (error), which indicates the proximity of measurement results to the true value. The two parameters are essential in choosing and evaluating the analytical performance of a method and are consistent with the quality of patient results, consequently, in the medical decision-making(2).
The accuracy of the analytical method mainly influences the analysis of tests performed for disease monitoring, that is, the variation of the method should not be greater than the biological variation of the analyte in the individual, which can make it difficult to evaluate the ongoing treatment(3). The accuracy of the analytical method, however, is especially related to the diagnosis of any health problem, as the result obtained in the analysis needs to be very close to the accuracy, in order to assess the patient’s health condition. However, most laboratory tests are used for both diagnosis and monitoring of diseases, being equally important the precision and accuracy of the method(4).
In addition to analyzing the IQC and EQC results, it must be evaluated for imprecision and inaccuracy the long-term analytical performance of each method, in accordance with the quality specifications (targets)(5, 6). There are hierarchical models for establishing quality goals, also called analytical quality specifications for CV, bias, and total error (TE) of each laboratory’s analytical method(7).
Keeping the same hierarchical order, after 15 years, the analytical quality specifications were revised and summarized from five to just three categories: specifications based on clinical decisions, biological variation, and state of the art. In addition, were listed criteria for the analysis and use of biological variation studies(8, 9).
The specification of quality based on biological variation is the most widely used. The method is more advantageous because it is accessible to any laboratory, regardless of size, location, and type, being consolidated with simple models applicable to medical needs(5). The coefficients of biological variation intra-individual (CVbi) and inter-individual or inter-group (CVbg) are used to define the quality specification (QS) of each parameter under optimal, desirable, and minimum conditions(3, 10).
The Westgard database compiles hundreds of studies and specifies the CVbi and CVbg of most laboratory parameters. However, a recent study, The European Biological Variation Study (EuBIVAS) of the European Federation of Clinical Chemistry and Laboratory Medicine has established values for CVbi and CVbg different from those previously used for some parameters(11, 12).
Since the standardization of resultsacrosslaboratoriesaround the world, regardless of the analytical platform used, is aimed at improving clinical decisionsandpatientsafety, the analysisand the comparison of the analytical performance representan important initiative not only in verifying the quality of a laboratory, butproviding data on how is going the standardizationprocessamonglaboratories(13).
Another way of evaluating and comparing analytical performance is through the Six Sigma methodology, which correlates its metric with the probability of errors (failures) that occurs in a million opportunities, seeking to reduce laboratory costs and increase customer satisfaction. In the Six Sigma model of total quality management, the sigma metric is the central objective measure of quality and the basis for developing quality control. The performance of a process can be measured by the equation adapted for laboratory medicine, where sigma (σ) = (desirable TE – bias%)/CV%. The higher the sigma, the better the performance(14-16).
Increasing quality in the laboratory aims to reduce waste from repeated tests, new collections, wrong diagnoses, and unnecessary treatments. It is difficult to estimate in numbers the total of expenses that can be saved, but it is guaranteed the impact of producing a result with acceptable analytical performance on clinical decisions and patient safety. The objectives of this study are to evaluate the analytical performance of biochemical parameters of a laboratory of a university hospital, in relation to quality specifications based on biological variation and compare it with data from the literature and from another large laboratory.
MATERIAL AND METHOD
The clinical analysis laboratory (CAL) of the Polydoro Ernani de São Thiago University Hospital (HU/UFSC), which has about 200 active beds, is a reference health establishment that, in 2017, treated 444,897 patients, being 127,096 inpatients and 317,801 outpatients care. The HU/UFSC cares for several medical specialties, providing the necessary support for the diagnosis and monitoring of the most varied diseases. In 2017, the CAL performed 692,875 tests, with an average of nearly 10,000 tests per employee. The most analyzed tests in the biochemistry sector were creatinine (41,912), urea (29,623), potassium (25,658), sodium (24,400) and glucose (23,301).
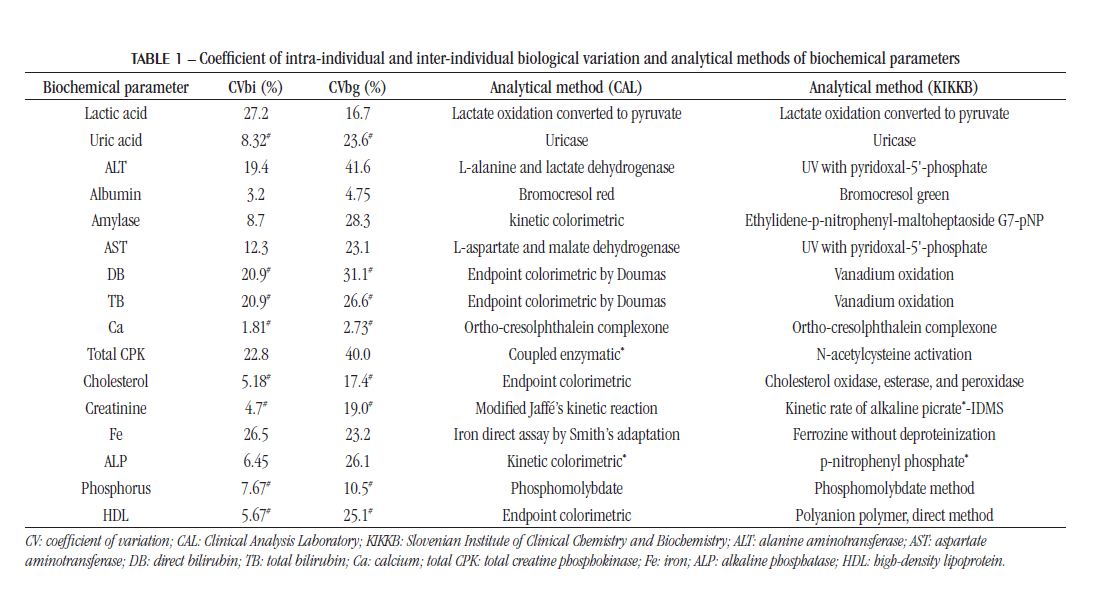
The analytical performance of biochemical parameters was evaluated: lactic acid, uric acid, alanine aminotransferase (ALT), albumin, amylase, aspartate aminotransferase (AST), direct bilirubin (DB), total bilirubin (TB), calcium (Ca), creatine phosphokinase (total CPK), total cholesterol (TC), HDL cholesterol, creatinine, iron (Fe), alkaline phosphatase (ALP), phosphorus (P), gamma-glutamyltransferase (GGT), glucose, lactate dehydrogenase (LDH), lipase, magnesium (Mg), potassium (K), total protein (TP), sodium (Na), triglycerides (TGL) and urea. The respective analytical methods are shown in Table 1.
The analytical quality specifications were defined according to the Spanish Society of Clinical Biochemistry (SEQC)(10), using the CVbi and CVbg from the Westgard or EuBIVAS database, shown in Table 1.
The data collection for IQC was performed in the Dimension® RxL Max 1 auto analyzer (Siemens, USA) in the Biochemistry Sector of the CAL at the HU/UFSC, which performs the IQC only once a day in the early morning. The analytical performance of the analytes from the university hospital was compared with the respective analytes from the laboratory of the Institute of Clinical Chemistry and Biochemistry [Klinični Inštitut Za Klinično Kemijo in Biokemijo (KIKKB)] Liubliana University Medical Center (Univerzitetni Klinični Center Ljubljana) Slovenia, which performs the IQC five times a day and uses the Advia® 1800 equipment, Siemens (USA) and received ISO 15189 accreditation. The Medical Center has about two thousand beds. In 2017, 6,510,455 exams were carried out, around 46 thousand tests per employee. Data were collected in 2018.
The CV was accessed by analyzing the results from the IQC on the autoanalyzer itself for the two levels of control serum. Were analyzed the control results obtained from January to May 2019, and were considered acceptable the results observed in 95% of the normal distribution, that is, within ± 2 standard deviations (SD) of the mean indicated by the control manufacturer.
To calculate the average bias the reports of the EQC were analyzed, provided monthly by the National Quality Control Program (PNCQ), from January to May 2019. It was considered a bias the percentage difference between the result of the control sample analyzed by the laboratory of the university hospital and the mean result of the paired group, represented in the report by the deviation from mean (DFM) (%).
The TE was calculated from the CV and the bias(17), and expressed as a percentage (%). The analytical performance of these parameters was classified as optimal, desirable, and minimal, according to quality specifications based on biological variation.
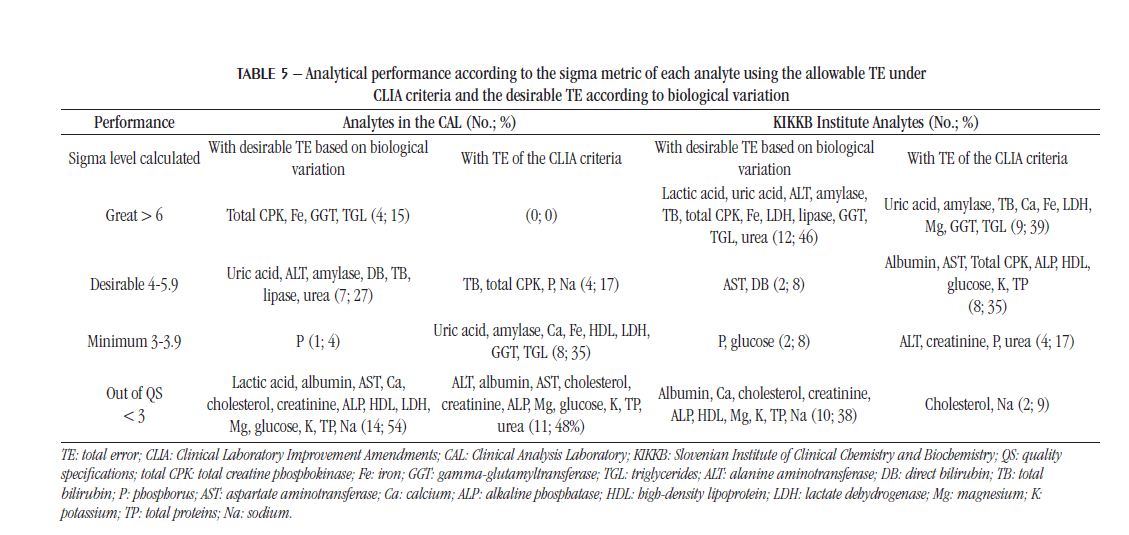
Taking into account the CV and bias, the sigma (σ) analytical performance of each biochemical analyte was also determined, using the Westgard online calculator(18) for comparison with other studies that use this metric. The sigma was calculated in two ways: using the desirable TE, according to quality specifications based on biological variation, and the allowable TE under the Clinical Laboratory Improvement Amendments (CLIA) criteria, updated in 2019(19). It was considered σ < 3 as unacceptable analytical performance.
RESULTS
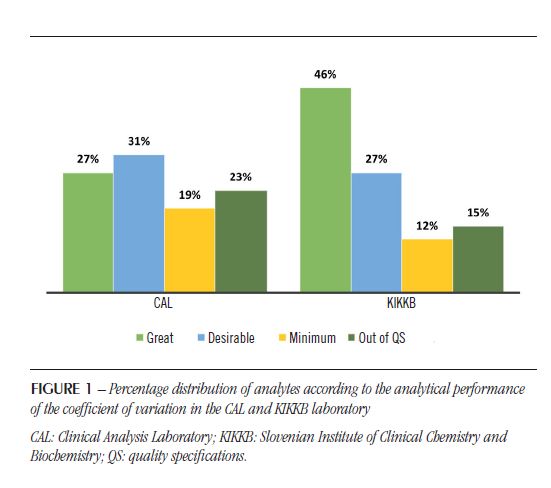
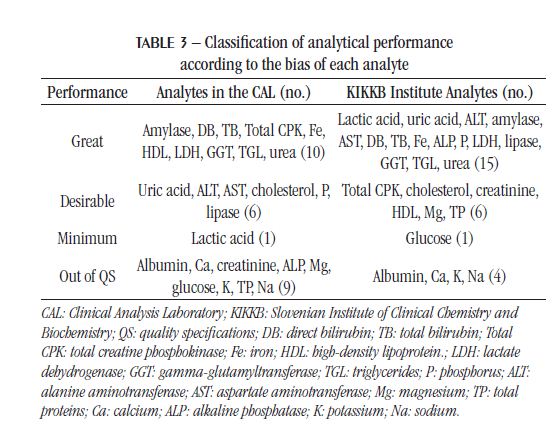
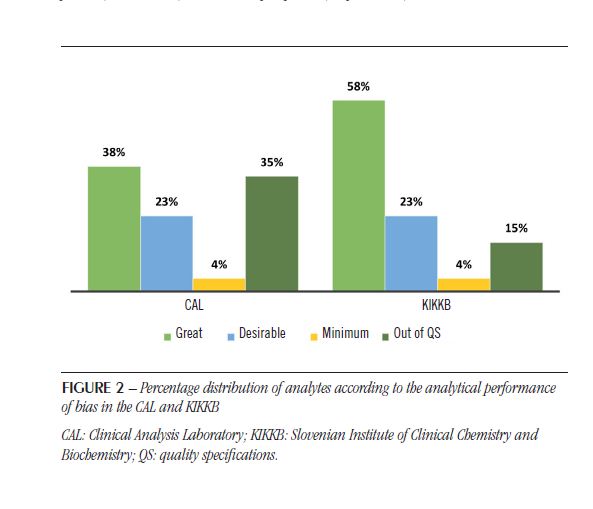
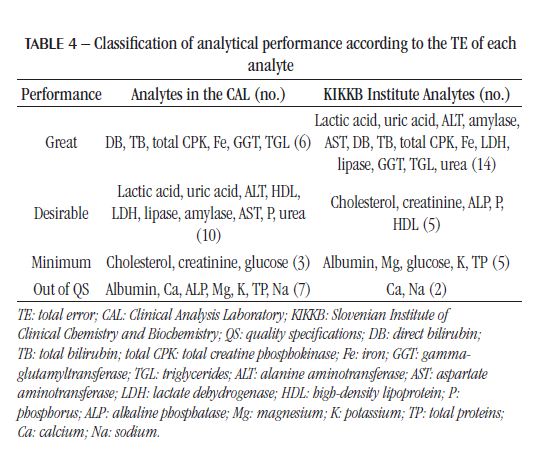
The IQC and EQC data were classified according to analytical performance based on intra-individual and inter-individual biological variation. The analytical performance analyzed by the CV of each biochemical parameter is shown in Table 2 and Figure 1. The analytical performance analyzed by the bias of each biochemical parameter is shown in Table 3 and Figure 2. The analytical performance analyzed by the total error of each biochemical parameter is shown in Table 4 and Figure 3. The biochemical analytes were also classified according to their sigma level of performance, as shown in Table 5.

DISCUSSION
Knowing the causes of errors can help considerably in recognizing errors and speeding up resolution while they are still occurring. When errors are identified by the IQC, the patient results should be delayed and re-analyzed after corrective action(20). Likewise, the bias observed in the EQC should be used to assess the possible impact on the outcome of previously released results.
The CV or random error, expressed as a percentage, represents the SD of the meanand is relatedto the inaccuracy of the method. When we performrepeatedmeasurements of a stablematerialunderidenticalconditions (the same operator using the same types of equipmentandreagents), we get a series of different resultsthat
are due to the random variation that occurs in every measurement process. This random error can be reduced by optimizing processes, but never eliminated(20). Regarding the CV, the KIKKB Institute presented a greater number of analytes with optimal performance, reaching 46% of the tests, while only 27% presented this performance in the CAL. The analytes that diverged in this criterion were amylase, lactic acid, uric acid, and urea, with desirable performance; and LDH, with minimal performance in the CAL. However, for the most part, they differed on only one level of performance.
Of all 26 analytes, 17 had the same analytical performance for CV in both laboratories. The CAL presented six analytes outside the QS for CV, being four out of the specifications in the KIKKB Institute: Ca, Mg, TP and Na. The inaccuracy, characterized by random variation in results, should be related to: different reagents batches used over the period evaluated, different calibrations of the analytical system, deterioration of the reagent water quality, timeout of filter replacement, noise electronics, unstable reading due to electrical problems, carry-over effect, needle contamination, system air bubbles, etc.(20).
As observed for CV, the bias also had more analytes outside the QS in the CAL (35%) than in KIKKB Institute (15%). Again, all KIKKB analytes outside the QS were also outside the QS in the CAL: albumin, Ca, Na and K.
Although the proficiencytestings are different, the observed bias was similarbetweenlaboratories. The reasons of bias are usuallyrelatedtoimproper sample transportation or storage, uncalibratedequipment, anddeterioration of reagentsandequipment(19). In addition, the use of proficiencytesting data mayoverestimate the bias, which is most likelydueto the random errorsthatalsooccur in these resultsand the rarity of the execution of the tests(21). Someauthorsarguethat the standardization of analyticalmethodscouldreduce the bias becausecomparing different methodsbecomescomplicated(22, 23). Anotherlimitation of assessing bias throughproficiencytestingresults is thatthey are not metrologicallytraceablelikereferencematerials(21).
In 2016, a study by Weykamp et al. (2017)(13) in Italy, Netherlands, Portugal, Spain, and the United Kingdom compared the TE between different equipment for the main biochemical analytes and classified them according to the QS based on the intra-individual and inter-individual biological variation of the Westgard database. The minimum quality specifications for TE were not met for Na, Chlorine (Cl), and Ca in any country and in any equipment, including Dimension® and Advia® devices(13), used respectively in the CAL and KIKKB Institute. These results confirm the unmet QS for the Na and Ca analytes in both laboratories evaluated in this study, even when the intra-individual and interindividual biological variation of the EuBIVAS study is employed. The TP and ALP tests, on the other hand, which were outside the QS in relation to TE in the CAL, showed minimum performance in Dimension® device, according to Weykamp et al. (2017)(13).
The CAL analytes that were out of the QS for CV, bias, and TE were: albumin, Mg, TP, Na, and Ca, representing 19% of the analytes. Therefore, these would be the analytes with the topmost significance for assaying the process and taking corrective conduct. Among these parameters, the Na test was one of the most requested in the laboratory in 2017. laboratories. The electrolyte analysis is quite sensitive to contaminants in the equipment hoses, filter saturation, and, consequently, the quality of the reagent water(24). Furthermore, these analytes have a very narrow biological variation, the lowest of all the biochemical analytes evaluated in this study. The intraindividual biological variation is around 0.5% and 2%, and the inter-individual, 1.5% and 3%, for Na and Ca, respectively, according to the EuBIVAS(11). According to the European Federation of Clinical Chemistry and Laboratory Medicine (EFLM) Biological Variation Database, the studies of biological variation of Na and Ca are from the years 1970 to 2018, being the EuBIVAS study the most recent to employ the Advia 2400® equipment. Thus, it is necessary to think of more adequate and less strict quality goals for analytes with a small biological variation or more robust methods capable of presenting greater accuracy.
Even using the Westgard biological variation database to calculate the quality goals, the Ca and Na analytes do not meet the specifications of any criteria (CV, bias, or TE) in both laboratories (results not shown). In the Westgard database, CVbi is 2.1% for Ca and 0.6% for Na, while decreasing to 1.81% and 0.53%, respectively, in the EuBIVAS study.
The specification of quality based on biological variation is advantageous because it sets demanding and objective goals that encourage the constant search for improvement. However, the goals may not be possible to achieve with the methods currently used(24). Some authors consider the use of biological variation very subjective for analytes with very narrow biological variation, such as Na, Cl, and albumin. According to Ricos et al. (2009)(25), only 10% of laboratories participating in the EQC by way of SEQC program meet the quality specifications of TE for albumin, 20% for HDL cholesterol, 50% for Na and Cl, and 70% for Ca, when to be calculated by biological variation. The authors suggest that the goals can be achieved by laboratories. However, the data used in that study are from laboratories that participate in the same specific proficiency testing without a specification of which selfanalyzer was used.
Analytical performance in relationto TE was more conflictingamonglaboratoriesfor ALP test, whichdemonstrateddesirable performance in KIKKBInstituteand was outside the QS in the CAL. In the studybyWeykamp et al. (2017)(13), bothDimension® andAdvia® equipmentdemonstrated minimum performance in relationtothisanalyte. Althoughconsideredtobe Siemens equipment, Dimension® andAdvia® are originallyfrom different companies: Bayer andDadeBehringer, respectively. Thus, identicalresultswere not expected; it is onlyassumedthatthey have the samequalitystandardformaintenanceandreagents.
The analysis of external quality control reports from the CAL demonstrates that a failure in a cycle influences overall analytical performance regardless of the size of the bias. For example, the analytes ALT, glucose, TP, Fe, K, and Na were considered unacceptable in one cycle, while ALP and lipase were considered unacceptable in two (results not shown). Of these analytes, those that were out of the QS based on biological variation were: ALP, glucose, PT, K, and Na. Lipase and ALT which achieved the desirable targets, and Fe showed excellent analytical performance.
Regarding TE for the CAL, 77% of the analyteswere in the QSwhenbased on Westgard databank, and 73% whenbased on EuBIVAS data. As forKIKKBInstitute, there was no difference in the number of analytes in the QSwhencomparedto the use of WestgardandEuBIVAS databases. The assessment of analytical performance, comparing the calculatedQSwith the biologicalvariation of the WestgardandEuBIVAS database, showed no significant difference in the performance classification of the analytes, onlyone level changeoccurs in one of the criteria (CV, bias, or TE) forsomeanalytes (results not shown). Overall, the EuBIVAS presents lowerintra-individualandhigherinterindividualbiologicalvariation data. Of the 15 analytesthat have biologicalvariation in both databases, 93% have lowerCVbi in the EuBIVAScomparedto the Westgard database, and 60% have higherCVbg in the EuBIVAScomparedto the Westgard database. Thus, most analytesroseone performance level relative to CV when they were ranked using the Westgard database (results not shown).
Another way to assess quality is to employ the sigma metric since it allows the comparison of quality among different processes(26). Using this criterion, the analytical performance of the CAL was inferior to KIKKB Institute, and the percentage of analytes with sigma > 3 in KIKKB was 61.5%, while in the CAL had less than half (46.2%) of the analytes with this performance, considering the desirable TE for the calculation of the metric. In both laboratories, the number of parameters outside the QS, that is, with unacceptable sigma (< 3), increased in relation to quality goals based on biological variation. When using the allowable TE under CLIA criteria to calculate sigma, the number of analytes outside the QS decreased for the CAL and KIKKB: from 54% to 48% and from 38% to 9%, respectively.
BerlitzandHaussen (2005)(26) found in the Advia 1650® equipment the lowestindexes of the sigma metric (< 2) for the transaminaseenzymes (AST and ALT) and the highestforTGL, uric acid, Na, andK (> 6), using the allowable TE based on the CLIA criteria. In ourstudy, when the desirable TE was used, bothCALandKIKKBInstitutepresented the Na andKanalyteswithunacceptable sigma values. In KIKKBInstitute, TGLanduric acid also had sigma > 6, and in the CALonlyTGL. Regardingtransaminases, ALT performed > 4 in the CALandKIKKB. On the other hand, AST got sigma 5 in KIKKBandunacceptable in the CAL. An improvement in the performance of the parameters in the Advia® equipment is observedwhencomparing the 1650 and 1800 models, since, whenusing the TE based on the CLIA criteria, onlytwoanalytes present unacceptable performance in the KIKKB (Advia® 1800).
When a method gets sigma > 6, strict IQC rules are not required(27). This is the case for the analytes creatinine, TGL, total CPK, amylase, and AST in the study by Singh et al. (2011)(27), who obtained sigma > 6 using the allowable TE based on the CLIA criteria; the urea test had low performance (sigma < 3). Compared to our data based on the desirable TE, only TGL, amylase, and total CPK achieved similar performance in the CAL and KIKKB. The creatinine test had unacceptable performance both in KIKKB and in CAL, which also had AST with sigma performance level < 3. The urea test had sigma 4 in the CAL and sigma > 6 in the KIKKB. Considering the results based on TE of the CLIA criteria, the urea test also has a sigma < 3 in the CAL and a minimum performance in the KIKKB Institute.
Analyteswith sigma performance level < 3 deserve special attentionand must beanalyzedbythree levels of control in the IQCtwice a day, applying the Westgardrules 13S/22S/R4S/41S (4, 15). In order toimprove the sigma of these parameters, bettermethodologiesandequipmentcanbeimplemented. In the laboratorywhere the studyby Mao et al. (2018)(15) was analyzed, the analytes Na, chloride, K, andurea had unacceptable sigma level (< 3). Both in CALandKIKKB, Na andK had sigma < 3 based on the desirable TE, buttheydifferwhencomparedto the TE based on the CLIA criteria, alsoused in the studyby Mao et al. (2018)(15).
On the other hand, analytes with sigma performance between 3 and 4 must be evaluated by two levels of control in IQC, also twice a day, with the same Westgard rules applied when sigma is < 3(4, 15). This would be applied to P, which had sigma between 3 and 4 in the CAL and KIKKB, and glucose, which had sigma between 3 and 4 in KIKKB when calculated from the desirable TE. The albumin test, which demonstrated this performance in the study by Mao et al. (2018)(15) carried out in the Beckman Coulter® AU5800 equipment, presented unacceptable sigma in the CAL considering the desirable TE and the CLIA criteria. For analytes with sigma performance level
between 4 and 6 and > 6, is recommended the evaluation by two levels of control in IQC, once a day, using the rule 12,5S and 13S, respectively(4, 15).
Another piece of equipment from Siemens, the Atellica® CH 930, performed better than Dimension® and Advia®, also evaluated in the study by Fasano et al. (2019)(28), with all 13 biochemical parameters analyzed with sigma > 3. However, to calculate the sigma metric, the study used the allowable TE according to CLIA criteria, which was similar or less rigorous than the allowable TE based on biological variation in most analytes. The authors themselves consider further constant updating of biological variation data and the recent procedures for standardizing these data for use in the calculation of allowable TE(28).
Evaluating the analytical performance by the sigma metric of eight enzymes (ALT, AST, GGT, amylase, lipase, ALP, CPK, and LDH) in the Cobas® 8000 c702 equipment (Roche, Germany), none of them presented unacceptable sigma(29). Of these enzymes, LDH, ALP, and AST had sigma < 3 in the CAL when considering the desirable TE, and ALT, AST, and ALP when considering the TE of the CLIA criteria. In KIKKB, only ALP presented sigma level < 3 when considering the desirable specifications for TE and no enzyme when considering the TE of the CLIA criteria. However, the sigma metric used in the study by Zeng et al. (2019)(29) was calculated based on the QS of the EFLM and not on the biological variation nor on the CLIA criteria as it happened in our study.
The allowable TE according to the CLIA criteria was more rigorous for analytes with greater biological variation compared to the desirable specifications for TE based on biological variation and less strict for analytes with a very narrow biological variation range, as is the case for Na and Ca.
Accordingto Mao et al. (2018)(15), the sigma metric serves as a self-assessmentmethod, without the needtocompare the performance withotherlaboratories, to plan the numberandfrequency of IQCinspections, andto produce accurate results. Still, the sigma metricprovedtobe more rigorous in evaluating the analytical performance of biochemical parameters whencomparedto the QSbased on biologicalvariation.
In order to ensure the quality of laboratory results, regardless of the method to be used, performance evaluation should be carried out whenever there is any change in the analytical process, preferably once a year.
CONCLUSION
In general, the analytical performance of the CAL was considered acceptable, as it presented results similar to those of the KIKKB Institute, which is 10 times larger and performs five more times IQC. In addition, only five (19%) of the analyzed analytes performed outside the QS on all criteria (CV, bias, and TE). The tests that should be targeted for improvement measures are: albumin, Ca, Mg, TP and Na. The sigma metric proved to be more rigorous in assessing the analytical performance of biochemical parameters compared to the quality specifications based on biological variation, as it increased to 11, the analytes (48%) outside the QS.
The non-achievement of the quality goals was not laboratoryspecific, as the performance of different parameters between the two laboratories and the comparative study is similar.
REFERENCES
- Kinns H, Pitkin S, Housley D, Freedman DB. Internal quality control: best practice. J Clin Pathol. 2013; 66(12): 1027-32.
- Camargo W. Controle de qualidade total. [Internet]. 2011 [accessed in May 25, 2019]. 150 p. Available at: http://ead.ifap.edu.br/netsys/public/livros/ LIVROS%20SEGURAN%C3%87A%20DO%20TRABALHO/M%C3%B3dulo%20I/Livro%20Controle%20da%20Qualidade%20Total.pdf.
- Aarsand AK, Roraas T, Bartlett WA, et al. Harmonization initiatives in the generation, reporting and application of biological variation data. Clin Chem Lab Med. 2018; 56(10): 1629-36.
- Fuentes-Arderiu X, Batista-Castellvi J, Canalias F, Dot-Bach D, Martinez-Casademont M, Miro-Balague J. Internal quality control and ISO 15189. Accredit Qual Assur. 2007; 12(7): 369-75.
- Basques JC. Especificações da qualidade analítica especificações da qualidade analítica. Labtest. 2009. 32 p.
- Fraser CG. The 1999 Stockholm Consensus Conference on quality specifications in laboratory medicine. Clin Chem Lab Med. 2015; 53(6): 837-40.
- Ceriotti F, Fernandez-Calle P, Klee GG, et al. Criteria for assigning laboratory measurands to models for analytical performance specifications defined in the 1st EFLM strategic conference. Clin Chem Lab Med. 2017; 55(2): 189-94.
- Sandberg S, Fraser CG, Horvath AR, et al. Defining analytical performance specifications: consensus statement from the 1st Strategic Conference of the European Federation of Clinical Chemistry and Laboratory Medicine. Clin Chem Lab Med. 2015; 53(6): 833-5.
- Westgard JO, Westgard SA. Quality control review: implementing a scientifically based quality control system. Clin Biochem. 2015; 53(1): 32-50.
- SEQC. Comité de garantía de la calidad y acreditación de laboratorios. Comisión de calidad analítica. Especificaciones de la calidad analítica en laboratorios clínicos con distintos niveles de recursos. Quim Cclin. 2000; 19: 219-36.
- Aarsand AK, Diaz-Garzon J, Fernandez-Calle P, et al. The EuBIVAS: within- and between-subject biological variation data for electrolytes, lipids, urea, uric acid, total protein, total bilirubin, direct bilirubin, and glucose. Clin Chem. 2018; 64(9): 1380-93.
- Carobene A, Marino I, Coskun A, et al. The EuBIVAS project: within- and between-subject biological variation data for serum creatinine using enzymatic and alkaline picrate methods and implications for monitoring. Clin Chem. 2017; 63(9): 1527-36.
- Weykamp C, Secchiero S, Plebani M, et al. Analytical performance of 17 general chemistry analytes across countries and across manufacturers in the inputs project of EQA organizers in Italy, the Netherlands, Portugal, United Kingdom and Spain. Clin Chem Lab Med. 2017; 55(2): 203-11.
- Nevalainen D, Berte L, Kraft C, Leigh E, Picaso L, Morgan T. Evaluating laboratory performance on quality indicators with the six sigma scale. Arch Pathol Lab Med. 2000; 124(4): 516-9.
- Mao X, Shao J, Zhang B, Wang Y. Evaluating analytical quality in clinical biochemistry laboratory using six sigma. Biochem Med. 2018; 28(2): 020904.
- Oosterhuis WP, Coskun A. Sigma metrics in laboratory medicine revisited: we are on the right road with the wrong map. Biochem Med. 2018; 28(2): 020503.
- Oliveira CA, Mendes ME, organizadoras. Gestão da fase analítica do laboratório: como assegurar a qualidade na prática. 1. ed. Rio de Janeiro: Controllab; 2011. 184 p.
- Westgard JO. Westgard QC: tools, technologies, and training for healthcare laboratories. Madison [Internet]. 2009 [accessed in May 20, 2019]. Available at: https://www.westgard.com/.
- CMS. Centers for Medicare & Medicaid Services. Clinical laboratory improvement amendments of 1988 (CLIA). Proficiency testing regulations related to analytes and acceptable performance. Fed Reg. 2019; 84: 1536-67.
- Basques JC. Usando controles no laboratório clínico. Labtest; 2016. 55 p.
- Ceriotti F. Deriving proper measurement uncertainty from internal quality control data: an impossible mission? Clin Biochem. 2018; 57: 37-40.
- Farrance I, Badrick T, Sikaris KA. Uncertainty in measurement and total error – are they so incompatible? Clin Chem Lab Med. 2016; 54(8): 1309-11.
- Farrance I, Badrick T, Frenkel R. Uncertainty in measurement and total error: different roads to the same quality destination? Clin Chem Lab Med. 2018; 56(12): 2010-4.
- SBPC/ML. Recomendações da Sociedade Brasileira de Patologia Clínica/Medicina Laboratorial (SBPC/ML): fatores pré-analíticos e interferentes em ensaios laboratoriais. 1. ed. Barueri: Manole; 2018. 464 p.
- Ricos C, Perich C, Minchinela J, et al. Application of biological variation – a review. Biochem Med. 2009; 19(3): 250-9.
- Berlitz FA, Haussen ML. Seis sigma no laboratório clínico: impacto na gestão de performance analítica dos processos técnicos. J Bras Patol Med Lab. 2005; 41(5): 301-12.
- Singh B, Goswami B, Gupta VK, Chawla R, Mallika V. Application of sigma metrics for the assessment of quality assurance in clinical biochemistry laboratory in India: a pilot study. Indian J Clin Biochem. 2011; 26(2): 131-5.
- Fasano T, Bedini JL, Fle P, et al. Multi-site performance evaluation and sigma metrics of 20 assays on the Atellica chemistry and immunoassay analyzers. Clin Chem Lab Med. 2019; 58(1): 59-68.
- Zeng Y, He H, Qin K, Zhang M, An Z, Huang H. Practical application of the sigma-metric run size nomogram for multistage bracketed statistical quality control analysis of eight enzymes. Clin Chim Acta. 2019; 492: 57-61.