Correlação entre os resultados de hemoglobina e hematócrito obtidos no eritrograma e na gasometria de pacientes pediátricos
Viviane M. Bernardes1; Fernanda N. Anderle2; Karine dos Anjos2; Christian Boller1
1.Faculdades Pequeno Príncipe, Curitiba, Paraná, Brazil.
2.Hospital Pequeno Príncipe, Curitiba, Paraná, Brazil.
J Bras Patol Med Lab. 2021; 57: 1-8.
DOI: 10.5935/1676-2444.20210055
CORRESPONDING AUTHOR
Viviane Martins Bernardes
ORCID 0000-0003-2394-7494
e-mail: vivimbernardes@hotmail.com
First Submission on 02/24/21
Last Submission on 02/24/21
Accepted for publication on 05/16/21
Published on 12/20/21
ABSTRACT
Introduction: The hematocrit (Hct) and hemoglobin (Hb) values are routinely used in hospitals to monitor the evolution of the patient’s health status and are the basis for clinical management. Both can be measured by the laboratory tests of blood gas analysis and complete blood count; however, the scientific literature on the equivalence between these results is controversial. Objectives: The present study compared the results of Hct and Hb from laboratory autoanalyzer and blood gas analyzer of a clinical laboratory of a high complexity pediatric hospital in Brazil and evaluated the correlation between them. Materials and methods: Results were collected from 2263 patients aged zero to 18 years who have simultaneous blood samples taken for full blood count and blood gas analysis over six months. For statistical calculations, patients were divided into children under 30 days, between 31-180 days, 180 days-2 years, and 2-18 years. Results: The results revealed a difference between the Hct and Hb results obtained by the different devices. Although a strong positive correlation between these results has been demonstrated in most age groups, children over two years had only a moderate correlation for Hb levels. Conclusion: Considering that such differences can result in changes in clinical and therapeutic management, it has been concluded that the alternate use of these methods is not recommended in the monitoring of pediatric patients unless a proper correction factor is determined and adopted to minimize methodological differences.
Key words: hematocrit; blood gas analysis; pediatrics; laboratories; patient.
RESUMO
Introdução: Os valores de hematócrito (Ht) e hemoglobina (Hb) são rotineiramente utilizados em hospitais no acompanhamento da evolução do quadro de saúde do paciente e embasam a conduta clínica. Ambos podem ser obtidos por meio dos exames laboratoriais de gasometria e hemograma; entretanto, a literatura científica sobre a equivalência entre esses resultados é controversa. Objetivos: O presente estudo objetivou comparar os resultados de Ht e Hb obtidos nos exames de hemograma e gasometria do laboratório de análises clínicas de um hospital pediátrico de alta complexidade no Brasil, bem como avaliar a correlação entre eles. Material e métodos: Resultados de 2.263 pacientes com idade entre 0 e 18 anos que realizaram hemograma e gasometria concomitantemente dentro de um período de seis meses foram coletados. Para cálculos estatísticos, os pacientes foram divididos em: crianças abaixo de 30 dias; entre 31 e 180 dias; 180 dias e 2 anos; e entre 2 e 18 anos. Resultados: Os resultados revelaram que existe diferença entre os resultados de Ht e Hb obtidos pelos distintos aparelhos. Embora uma forte correlação positiva entre esses resultados tenha sido demonstrada na maioria das faixas etárias, crianças acima de 2 anos obtiveram apenas correlação moderada para os níveis de Hb. Conclusão: Considerando que tais diferenças podem resultar em alterações no manejo clínico e terapêutico, conclui-se que a utilização alternada desses métodos não é recomendada no acompanhamento de pacientes pediátricos, a menos que um fator de correção próprio seja determinado e adotado a fim de minimizar diferenças metodológicas.
Unitermos: hematócrito; gasometria; pediatria; laboratórios; pacientes.
RESUMEN
Introductión: Los valores de hematocrito (Hto) y hemoglobina (Hb) se utilizan de forma rutinaria en los hospitales para monitorizar la evolución del estado de salud del paciente y apoyar el manejo clínico. Ambos pueden medirse mediante pruebas de laboratorio de análisis de gasometría y hemograma completo. Sin embargo, la literatura científica sobre la equivalencia entre estos resultados es controvertida. Objetivos: El presente estudio tuvo como objetivo comparar los resultados de Hto y Hb obtenidos mediante hemograma y gasometría en el laboratorio de análisis clínicos de un hospital pediátrico de alta complejidad en Brasil, así como evaluar la correlación entre ellos. Material y métodos: Se recogieron los resultados de 2.263 pacientes con edades comprendidas entre 0 y 18 años, a los que se les realizó concomitante hemograma y gasometría dentro de seis meses. Para los cálculos estadísticos, los pacientes se dividieron en: niños menores de 30 días; entre 31-180 días; 180 días-2 años; y 2-18 años de edad. Resultados: Los resultados revelaron una diferencia entre los resultados de Hto y Hb obtenidos por los diferentes equipos. Aunque se ha demostrado una fuerte correlación positiva entre estos resultados en la mayoría de los grupos de edad, los niños mayores de 2 años solo obtuvieron una correlación moderada para los niveles de Hb. Conclusión: Considerando que tales diferencias pueden resultar en cambios en el manejo clínico y terapéutico, se concluye que no se recomienda el uso alterno de estos métodos en el seguimiento de pacientes pediátricos a menos que se determine y adopte un factor de corrección adecuado para minimizar las diferencias metodológicas.
Palabras clave:hematocrito; gasometría; pediatría; laboratorios; paciente
INTRODUCTION
The technological revolution has brought great changes to clinical analysis laboratories, allowing, in addition to the quantification of a broad variety of analytes, greater concern with the quality of results and the impact of their interpretations on the adoption of clinical and patient care procedures(1).
Hematocrit (Hct) and hemoglobin (Hb) values are routinely used in hospitals to monitor the evolution of patient’s health records, supporting clinical and therapeutic management(2). These values can be obtained through complete blood count and blood gas analysis laboratory tests, although the scientific literature on the equivalence between these results and the reliability of blood gas analyzers is controversial(3 ,4).
Gas analyzers allow obtaining results in a few minutes, speeding up the decision-making process and enabling the adoption of quick clinical procedures, which are particularly important in cases of care
for patients at risk of death and in emergencies. However, its use in the Hct and Hb measurement concomitantly with hematology analyzers is questionable(3). Furthermore, even if they are used as equivalent results, hematology analyzers and blood gas analyzers differ significantly in their methodologies, type of sample, and anticoagulant used(4, 5).
Although there are several studies evaluating the reliability of blood gas analysis results for Hct and Hb values, with significantly divergent conclusions(3, 4, 6, 7), the pediatric population is not included in these analyses, which implies a lack of knowledge on the conformity of results between these two methods in this specific population.
The present study aims to compare the Hct and Hb results obtained from complete blood count and blood gas analysis in the clinical laboratory of a high-complexity pediatric hospital in Brazil, as well as to assess the correlation between them. This study has great scientific relevance as it is the first to carry out such an analysis considering exclusively the pediatric population. Furthermore, the correct interpretation of results is a key point in the quality assurance process of the service, enabling a safe and effective clinical management of the population served.
MATERIAL AND METHODS
This study was carried out after obtaining the favorable opinion of the Research Ethics Committee (REC) of the institution, under CAAE number: 35122620.0.0000.5580; it was based on the norms and guidelines for research involving human beings, regulated by Resolution 466/12 of the Brazilian National Health Council (Brasil, 2012). This is a quantitative, retrospective documental analysis of the Hb and Hct results obtained from complete blood count and blood gas analysis performed in the clinical analysis laboratory of a high-complexity pediatric hospital located in Curitiba (Paraná, Brazil).
Currently, the hospital has 390 inpatient beds and four intensive care units (ICU) and, moreover, emergency care services and outpatient clinics in various specialties that result in high demand for laboratory tests. In 2019, the laboratory performed 836,510 tests and provided care to a total of 110,239 patients; from these, 61.67% were intended for patients from the Brazilian Unified Health System [Sistema Único de Saúde (SUS)].
Data collection and eligibility criteria
Data were screened for all patients aged between 0 and 18 years who underwent complete blood count and blood gas analysis between January and June 2020. The results were obtained from the clinical analysis laboratory tests management system of the study hospital. Individuals who had their samples collected at the same time and with the same protocol number for both tests were included in the analysis. Recurrent laboratory results from a single patient were excluded, keeping only the first exam of each child. Hb < 6 and > 20, and Hct < 21 and > 60 results detected in at least one of the equipments were also excluded, and these values were defined by the laboratory as “critical results”.
Laboratory protocols and analysis
Arterial or venous blood samples for blood gas analysis were obtained in ready-to-use heparinized syringes (BD blood gas syringe A-line 3 ml blood – 1.6 ml aspiration – Ref. 365060) and measured in the GEM Premier 3500 gas analyzer (Instrumentation Laboratory, Bedford, MA, USA). The maximum time between collection and processing of blood gas samples, standardized in the study laboratory, is 15 minutes for samples at room temperature and one hour for samples refrigerated from 2°C to 8°C. Peripheral blood samples for CBC were obtained in an ethylenediaminetetraacetic acid (EDTA) tube (S-Monovette® K3 EDTA, 2.6 ml) and analyzed on a CELL-DYN Ruby (Abbott Laboratories, Diagnostic Division, Abbott Park, IL, USA), within a maximum period of four hours between collection and analysis. Both types of equipment are calibrated daily, according to the manufacturer’s instructions, and strictly follow the quality control protocols stipulated by the laboratory.
Statistical analysis
Stratified probability sampling was performed according to the month of collection and the age of the children. The time stratification considered the total number of tests performed in the period from January to June 2020 and the relative number of tests in each month. Children’s ages were stratified into children younger than 30 days; between 31 days and 180 days; between 180 days and 2 years; and above 2 years. Data analysis was performed using Microsoft Excel 365 and GraphPad Prism v.5.0 software.
RESULTS
After applying the exclusion criteria, from a total of 3,974 orders with a concomitant order for complete blood count and blood gas analysis, carried out in the period described, 2,263 were analyzed, 152 (6.72%) from children younger than 30 days; 286 (12.64 %) between 31 days and 180 days; 104 (4.59 %) between 180 days and 2 years; and 1,721 (76.05%) of children between 2 and 18 years old.
Hct analysis
Figure 1 shows the mean Hct data (± standard deviation) of patients separated by age group for each type of equipment. For patients aged 0 to 30 days (Figure 1A), the total number of pairs evaluated was 152 with a positive correlation coefficient
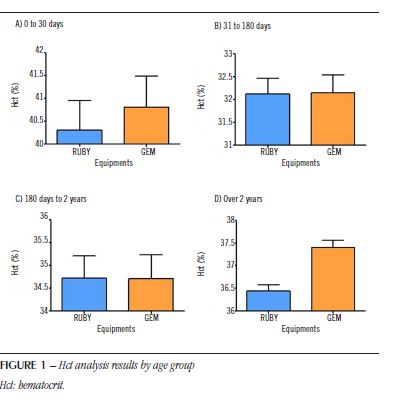
(R = 0.9626). For the RUBY equipment, the values are 40.3% (± 8.1%), and for the GEM equipment, 40.8% (± 8.4%). After evaluating the two groups using the paired Student’s t-test, the results showed a statistical difference (p < 0.05) between the groups, showing that the results indicated by the equipments are statistically different [t = 2.694; degree of Freedom (dF) = 151]. For patients aged 31 to 180 days (Figure 1B), the total number of pairs evaluated was 286 with a positive correlation coefficient (R = 0.9163). For the RUBY equipment, the values are 32.1% (± 5.8%), and for the GEM equipment, 32.1% (± 6.6%). For patients from 180 days to 2 years of age (Figure 1C), the total number of pairs evaluated was 104, with a positive correlation coefficient (R = 0.9187). For the RUBY equipment, the values are 34.7% (± 4.9%), and for the GEM equipment, 34.7% (± 5.2%). After evaluating the two groups by the paired Student’s t-test, the results did not show the statistical difference (p > 0.05) between the groups, demonstrating that the results indicated by the equipments are not statistically different for the age groups from 31 to 180 days (t = 0.134; dF = 285), and 180 days to 2 years (t = 0.032; dF = 103).
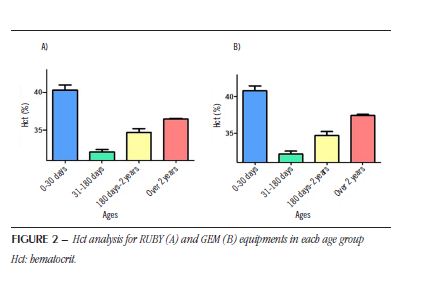
For patients older than 2 years of age (Figure1D), the total number of pairs evaluated was 1,721, with a positive correlation coefficient (R = 0.9187). For the RUBY equipment, the values are 36.4% (± 5.7%), and for the GEM equipment, 37.4% (± 6.4%). After evaluating the two groups using the paired Student’s t-test, the results showed a statistical difference (p < 0.05) between the groups, demonstrating that the results indicated by the equipments are statistically different (t = 14.79; dF = 1720). The mean Hct data (± standard deviation) of patients in different age groups, previously presented in the RUBY and GEM equipments, are shown in Figure 2. After evaluating all groups in one-way analysis of variance (Anova) with Newman-Keuls post hoc test for multiple comparison, the results showed a statistical difference (p < 0.05) between all studied groups (RUBY: F test = 73.3; dF = 2262; GEM: F test = 74.8; dF = 2262).
Hb analysis
Figure 3 shows the mean Hb data (± standard deviation) of patients by age group for each type of equipment.
For patients aged 0 to 30 days (Figure 3A), the total number of pairs evaluated was 152, with a positive correlation coefficient (R = 0.9117). For the RUBY equipment, the values are 14.1% (± 2.7%), and for the GEM equipment, 13.4% (± 2.8%). For patients aged 31 to 180 days (Figure 3B), the total number of pairs evaluated was 286, with a positive correlation coefficient (R = 0.8936). For the RUBY equipment, the values are 11% (± 1.9%), and for the GEM equipment 10.6% (± 2.1%).
For patients older than 2 years of age (Figure 3D), the total number of pairs evaluated was 1,721, with a positive correlation coefficient (R = 0.6172). For the RUBY equipment, the values are 12.2% (± 1.9%), and for the GEM equipment, 12.4% (± 3%). After evaluating the two groups using the paired Student’s t test, the results showed a statistical difference (p < 0.05) between the groups, demonstrating that the results indicated by the equipments are statistically different for these age groups (t = 7.172; dF = 151; t = 6.598; dF = 285 and t = 3.759; dF = 1.720, respectively).
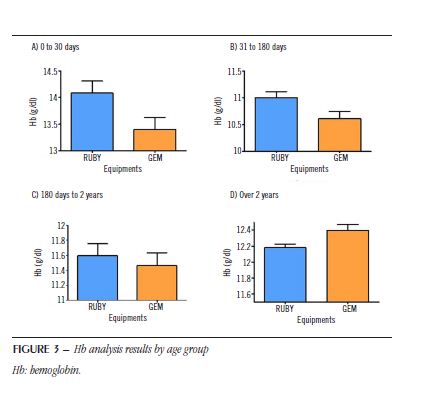 For patients from 180 days to 2 years of age (Figure 3C), the total number of pairs evaluated was 104, with a positive correlation coefficient (R = 0.8968). For the RUBY equipment, the values are 11.6% (± 1.6%), and for the GEM equipment, 11.4% (± 1.7%). After evaluating the two groups using the paired Student’s t-test, the results did not show any statistical difference (p > 0.05) between the groups, demonstrating that the results indicated by the equipments are not statistically different (t = 1.724; dF = 103).
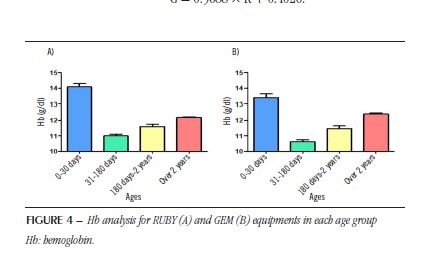
The mean Hb data (± standard deviation) of patients in different age groups, previously presented in the RUBY and GEM equipments, are shown in Figure 4. After evaluating all groups by Anova with the Newman-Keuls post hoc test for multiple comparison, the results showed a statistical difference (p < 0.05) between all studied groups (RUBY: F = 81.2; dF = 2262; GEM: F = 42.6; dF = 2262).
Comparative analysis between the two tests
Figure 5 shows the correlation of Hct (A) and Hb (B) data for each patient performed in the RUBY equipment and its interpolation with the GEM equipment.
From the linear regression analysis between the Hct data, we notice that it is positive (r2 = 0.85). Considering that there is a statistical difference between the results of the equipments detailed above, the equation that relates the two results was calculated, as follows: y = 1.033x (± 0.009) – 0.4319 (± 0.3324). Thus, since y corresponds to the Hct value of the GEM equipment (G) and x to the hematocrit value of the RUBY equipment (R), the following equation can be established:
G = 1.033 × R – 0.4319.
From the linear regression analysis between the Hb data, we notice that it is also positive (r2 = 0.8). Likewise, the equation that relates the two results was calculated, as follows: y = 0.9688x (± 0.010) + 0.4026 (± 0.1238). Since y corresponds to the Hb value of the GEM equipment (G) and x to the Hb value of the RUBY equipment (R), the following equation can be established: G = 0.9688 × R + 0.4026.
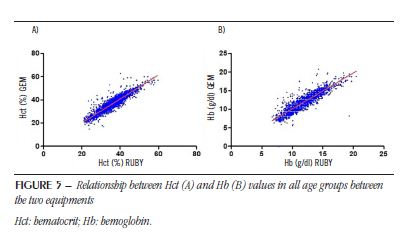
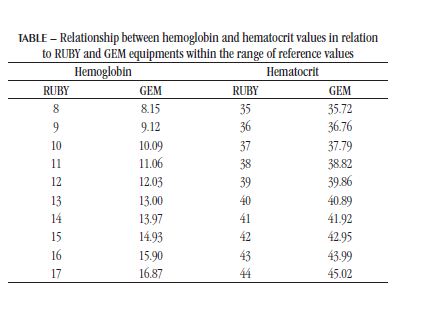
Based on the results, it can be inferred that there is a difference between the two equipments. From the equations provided it is shown below which would be the Hb and Hct values in the GEM equipment, when the values in RUBY are presented. For calculation purposes, intervals between the reference values of each test were used. The deviation from linearity assessment of the Hct graph using the GraphPad Prism software showed that there is a linear correlation between the equipments from 21% to 47% (p > 0.05). For Hb graph, the linearity corresponds to a range of 7 to 18 g/dl (p > 0.05). Considering the reference values listed in the Table, it is considered that the correlation between the equipment is linear within the normality parameters of the test.
DISCUSSION
The complete blood count is one of the most requested laboratory tests in the routine of a clinical laboratory. It provides a quick and cost-effective assessment of the patient’s health status(2) and plays an essential role in diagnosing anemia, in the evolutionary control of infectious and chronic diseases, in medical emergencies, as well as in monitoring and responsiveness to treatments(8). Equally important, blood gas analysis is the test that analyzes the gases present in the blood; it is very useful in the evaluation of acid-base disturbances, ventilator and oxygenation abnormalities. It is used in the evaluation of critically ill patients or stable patients with chronic respiratory diseases, especially in cases that it is necessary to assess the need for supplemental oxygen or noninvasive ventilation, and also useful in evaluating the response to different types of therapeutic interventions, whether pharmacological or not(9).
Despite based on different methodologies, both complete blood count and blood gas analysis provide Hct and Hb measurements(6).
The optimization of the size of blood gas analyzer equipments associated with more automated and easy-to-handle systems enabled their use as point-of-care (POC) tests, that is, carried out at the patient’s care facility, contributing to a faster sample analysis, reduction of pre-analytical errors, and agility in decision-making by the medical staff(6, 10). Even with these advantages, numerous studies have evaluated the reproducibility and reliability of these results when compared, for example, with hematology autoanalyzers. The equivalence between these results, in an exclusively pediatric population, was the focus of this research.
Based on the analyzes carried out in this study, it can be inferred that there is a difference between the Hct and Hb results obtained by the different equipments, although this result was not observed in the 31-180 days and 180 days-2 years age groups. However, despite the difference, a strong positive correlation was shown between the Hct and Hb results obtained by the different equipments in all age groups, except for children older than 2 years, who obtained a moderate correlation (R = 0.6172) for Hb levels. The scientific literature on the agreement between Hct and Hb results obtained by blood gas analyzers and hematology analyzers in the pediatrics field is limited. In neonates, monitoring Hct and Hb levels using POC blood gas analyzers has clear advantages. Infants in need of neonatal intensive care are subjected to frequent blood collections, which can result in iatrogenic anemia. The use of the blood gas analyzer has proven to be a useful tool in monitoring neonatal care as it provides a quick and reliable measurement of Hb concentration using a low sample volume(7).
Altunoketal. (2019)(3) compared, among other biochemical parameters, the results of Hct and Hb obtained in the complete blood count and blood gas analysis of 31,060 adult patients admitted to the emergency room of a tertiary care university hospital. Although a strong correlation (> 0.8) between the measurements obtained in the two types of equipment has been demonstrated, none of the results obtained by gas analyzers had acceptable limits of agreement. Thus, the study with the largest sample size that we are aware of demonstrated low reliability of gas analyzers, suggesting that abnormal results are confirmed in laboratory auto-analyzers, even in critically ill patients, although in these cases it is recommended to initiate treatment accordingly with the results of the blood gas test until its confirmation.
Prakash et al. (2018)(6) analyzed the agreement between the POC blood gas analyzer and the laboratory auto-analyzers in the Hb and electrolytes measurement in critically ill patients. The results could be considered interchangeable as long as they met the variability criteria of the US Clinical Laboratory Improvement Amendments (US-CLIA) of 1988, and did not change the clinical management when compared to each other. Hb results had a low limit of agreement and high bias, which could result, for example, in inadequate transfusion therapy. The discrepancy of results between the two tests, concerning the transfusion threshold, in this study, demonstrated that the Hb measurement in hematology analyzers indicates blood transfusion 3-4 times more frequently than when measured in a gasometer. Although moderate to substantial agreement between equipments has been demonstrated, the authors do not recommend the alternate use of the two test methods.
Accordingly, Murphy (2020)(11), hematologist and head of the Blood Transfusion Department at a reputable university hospital in Ireland, illustrated how inaccurate measurement of Hb by the blood gas analyzer can lead to serious adverse clinical consequences. In a case that occurred at his institution, an erroneous measurement of Hb (5 g/dl) in a patient using medication to control heart rate, whose late confirmation by complete blood count revealed a correct Hb result (10.9 g/dl), led to the false assumption of major bleeding, resulting in inappropriate clinical management, including patient transfer to the ICU and unnecessary administration of blood products.
On the other hand, when analyzing the reliability of gas analyzers and the costs arising from the simultaneous performance of complete blood count and blood gas analysis in ICU patients, Triplett et al. (2019)(4) observed that the two measurement methods agreed with each other in most clinical situations when their values were within or close to the normal range, concluding that the cross-checking of Hb results is unjustified and causes unnecessary costs, and should be reserved for situations where unexpected or extreme results are obtained in one of the measurement methods.
The accuracy and reliability of results obtained in gas analyzers can be compromised by several factors, such as air aspiration or bubbles formation in the syringe, hemolysis, choice and rate of anticoagulant, homogenization, and sample transport. Massive hemolysis may contribute to an error in Hct in equipments that measure Hct by conductance, but not in equipments that calculate it from the Hb concentration since the Hb concentration is usually determined after the sample is hemolyzed by the equipment(12). It is worth remembering that in the GEM Premier 3500, the gas analyzer used in this study, blood conductivity is the method used to measure Hct, and Hb value is derived from this reading(10). Furthermore, the fact that Hb is not a value measured in the GEM may have influenced the moderate correlation found in our study for Hb levels in children older than 2 years of age.
Another potential interfering factor in the Hct measurement in blood gas analysis is sample homogenization, which must be performed after collection and before analysis in the equipment, in order to ensure proper dispersion of the anticoagulant in the sample and reverse any erythrocyte sedimentation that may have occurred before analysis. Furthermore, a minimum time between samples transportation and analysis must be kept, minimizing metabolic changes that occur naturally in the sample. The high speed of the sample caused by its transportation in pneumatic couriers can also interfere with the results of the blood gas analysis, especially in the pO2 and Hct measurements. These interferences during sample transport are minimized with the use of POC blood gas analyzers, although, in this case, other interferences should be considered, such as sample processing by professionals with limited knowledge on laboratory analysis, who possibly would not strictly adhere standard operating procedures as trained laboratory workers would, especially during emergencies(11).
Considering that significant differences were observed between the Hct and Hb results obtained in GEM and RUBY in different age groups and that the Anova and linear regression analyzes also showed significant differences between these results, the adoption of a correction factor for Hct and Hb obtained in the blood gas test is suggested, so that they are equivalent to that obtained in the complete blood count test. Applying this measure can be useful in laboratories that use both tests alternately since each laboratory calculates their correction factor based on the analysis of their population.
Finally, a situation that can be highlighted from the analyzes performed in this study is the fact that in Hct, regardless of the concentration, the value obtained in the GEM value (from RUBY) will always be higher at any concentration. In the case of Hb values, it is observed that up to a 13 g/dl concentration in the RUBY equipment, the values for GEM are higher; above 13 g/dl in the RUBY equipment, the value observed in the GEM equipment will be lower. Another important factor observed in the research is the Hct values, which have the highest values from birth to 30 days of life, significantly decrease after this period. Throughout childhood, these numbers rise, without, however, reaching the values found at birth. Similar results are shown in the literature(13). Observing these patterns from laboratory investigations allows us to know and understand biological profiles and local variations in the population served, directly contributing to the accurate monitoring of patients(14).
Some notable limitations can be pointed out in this study, such as the fact that it is single-centric and retrospectively analyzed patient data, as well as the scarcity of pediatric studies to compare results and the lack of factors control such as clinical diagnosis of patients, processing time between samples and sample type (arterial vs. venous). However, strengths of the study include the sample size and analysis of all age groups between 0 and 18 years.
CONCLUSION
From the analysis performed in this study, it can be inferred that there is a difference between the Hct and Hb results obtained by blood gas analyzers and hematology analyzers. Although a strong positive correlation between these results has been demonstrated in most age groups, children older than 2 years old only obtained a moderate correlation for Hb levels. Considering that such differences can result in changes in clinical and therapeutic management, we conclude that the alternate use of these methods is not recommended in the follow-up of pediatric patients unless a proper correction factor is determined and adopted to minimize methodological differences.
REFERENCES
1. Sociedade Brasileira de Patologia Clínica/Medicina Laboratorial (SBPC/ML). Recomendações da Sociedade Brasileira de Patologia Clínica/Medicina Laboratorial: fatores pré-analíticos e interferentes em ensaios laboratoriais. Barueri: Manole; 2018.
2. Green R, Wachsmann-Hogiu S. Development, history, and future of automated cell counters. Clin Lab Med. 2015; 35(1): 1-10.
3. Altunok İ, Aksel G, Eroğlu SE. Correlation between sodium, potassium, hemoglobin, hematocrit, and glucose values as measured by a laboratory autoanalyzer and a blood gas analyzer. Am J Emerg Med. 2019; 37(6): 1048-53.
4. Triplett KE, Wibrow BA, Norman R, et al. Can the blood gas analyser results be believed? A prospective multicentre study comparing haemoglobin, sodium and potassium measurements by blood gas analysers and laboratory auto-analysers. Anaesth Intensive Care. 2019; 47(2): 120-7.
5. Pamidi PVA, Velankar M, Kovalchick E. Blood Collection Device Specific Bias on Hematocrit Measurements. 68th Am Assoc Clin Chem Annu Sci Meet. 2016.
6. Prakash S, Bihari S, Lim ZY, Verghese S, Kulkarni H, Bersten AD. Concordance between point-of-care blood gas analysis and laboratory autoanalyzer in measurement of hemoglobin and electrolytes in critically ill patients. J Clin Lab Anal. 2018; 32(6): 1-5.
7. Hinds LE, Brown CL, Clark SJ. Point of care estimation of haemoglobin in neonates. Arch Dis Child Fetal Neonatal Ed. 2007; 92(5): 378-80.
8. Failace R, Fernandes F. Hemograma: manual de interpretação. 6 ed. Porto Alegre: Artmed; 2015. 482 p.
9. Davis MD, Walsh BK, Sittig SE, Restrepo RD. AARC clinical practice guideline: blood gas analysis and hemoximetry: 2013. Respir Care. 2013; 58(10): 1694-703.
10. Instrumentation Laboratory Co. GEM Premier 3500. Manual do Operador. Rev 00. PN 26000200. 2009; 1: 310.
11. Murphy PT. Inaccurate haemoglobin measurement by blood gas analyzer may lead to severe adverse clinical consequences. Am J Emerg Med [Internet]. 2020; 38(2): 395. Available at: https://doi.org/10.1016/j.ajem.2019.158396.
12. Baird G. Preanalytical considerations in blood gas analysis. Biochem Medica. 2013; 23(1): 19-27.
13. Zierk J, Arzideh F, Rechenauer T, et al. Age- and sex-specific dynamics in 22 hematologic and biochemical analytes from birth to adolescence. Clin Chem. 2015; 61(7): 964-73.
14. Adeli K, Higgins V, Trajcevski K, White-Al Habeeb N. The Canadian laboratory initiative on pediatric reference intervals: a CALIPER white paper. Crit Rev Clin Lab Sci. 2017; 54(6): 358-413.